This page summarises research on a new dinosaur supertree, and some major new discoveries about the pattern of dinosaur evolution. In particular, we find that dinosaurs did most of their diversifying in the first third of their 160 million years on Earth, and they continued to evolve steadily after that. But they did not benefit from the great revolution in terrestrial ecosystems that occurred in the Cretaceous, a series of events we term the Cretaceous Terrestrial Revolution.
Aims of the study
- To produce the most comprehensive phylogenetic tree of Dinosauria
- To determine when dinosaurs did most of their evolving
- To determine whether dinosaurs were in decline or radiating in the time before their final extinction
Background
Several years ago, a different ‘Bristol team’, but including some of the same members, produced the first supertree of dinosaurs, incorporating 277 species, and based on 150 source trees. This served its purpose, and was the largest supertree attempted at that time. However, with 277 species included, this covered only some 50% of dinosaurian diversity.There are in fact some 550-600 valid currently accepted species of dinosaurs (out of 1400 named species), so we wanted to improve the coverage, and then to use new numerical methods to determine some key facts about dinosaurian evolution that had hitherto not been explored adequately. Most studies on patterns of dinosaurian evolution have used either a taxon counting or a non-quantitative phylogenetic approach. Taxon counting is adding up the number of species, genera, or families present in a particular unit of time: the relative fate of the group can then be followed, with rises indicating radiations, and drops indicating declines. There are many published phylogenetic trees of small, or medium-sized, groups of dinosaurs, but no comprehensive tree of all species or genera. Nonetheless, it is possible to track individual lineages and clades, and to describe their fates in a non-quantitative way.
A problem with all such studies is that rises and falls may also be a reflection of sampling, the fact that geology and human endeavour are heterogeneous. Geological errors reflect the volume of rock deposited at particular times – represented by the thickness or map area we can see today, and by the number of named geological formations. Further, named geological stages, such as the Norian or Maastrichtian, may be of highly variable duration, and total diversity measures should at least take account of time available. Human variables reflect the accesibility of sites (for example, dinosaur sites in Europe and North America have been more actively sampled than those in remote parts of Africa or South America), as well as scientific interest (for example, flesh-eating theropod dinosaurs seem to attract more attention than plant-eating sauropods or ornithopods; and there may have been a concentration on certain critical time periods, such as the Maastrichtian stage, just before the dinosaurs died out, that could inflate apparent numbers of species).
Making the supertree
Since the first cladistic studies on dinosaurs in the early 1980s, over 550 individual cladograms of small to large clades among Dinosauria have been produced. Many of these are developments of earlier analyses, some of them are by long-standing workers or teams, and yet others are unique contributions. Further, although the basic framework of the dinosaur cladogram is more or less agreed by all – the existence of Saurischia, Ornithischia, Sauropodomorpha, Theropoda, Coelurosauria, Maniraptora, Sauropoda, Cerapoda, Ornithopoda, Marginocephalia, Ceratopsia, Pachycephalosauria, Thyreophora, Stegosauria, Ankylosauria – more detailed aspects are much debated and disputed.<id=”diversity”>So, we trawled all 550 published cladograms, and used widely accepted methods to minimize redundancy and repetition – such as concentrating on more recent trees, combining and weighting multiple overlapping efforts by cohesive teams or individuals. The effort left us with 420 species as terminal taxa, representing some 70% of all valid species. [We could not include all species, because many have never been included in a cladogram – these could, however, be added by hand to their appropriate families or genera.] The methods we used are outlined here.
Out of all the tree solutions for the huge analysis, the best was this one:
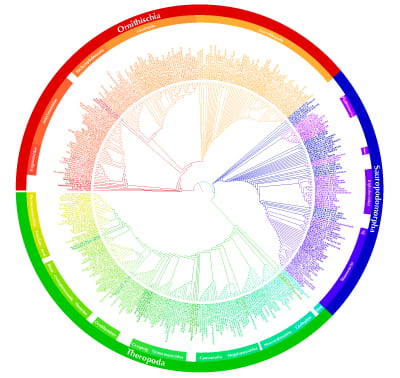
You can see a further version of the supertree, with zoom capabilities here.
Dinosaur diversity through time
Dinosaurs, like all natural groups, started out with a single common ancestor, but over time increased in diversity as species split and multiplied, with some going extinct and others continuing to split. The fossil record is our only evidence for how this pattern of diversification panned out, but how far we can trust a literal reading of the rocks is debated.
Using a database of dinosaur species through time we calculated rates of diversification (the proportional change in species numbers through time) – the blue line in (b) on the figure below. What this line shows us is some fairly major fluxes in dinosaur evolution including big bursts of increased diversity in the Late Triassic (c. 210 million years ago), Middle and Late Jurassic (165-150 million years ago) and a final one in the Late Cretaceous (75 million years ago). There is also a major fall-off in diversity in the Early Jurassic (180 million years ago).
Our next move was to use our supertree to fill in some missing parts of the dinosaur record: so-called ghost ranges. As a concept ghost ranges have been known of for some time, but they only received their formal name in 1992 following the work of the American palaeontologist Mark Norell. The basic idea is that two species that are nearest relatives share a common ancestor and hence diverged from one another at the same time. However, because of the incompleteness of the fossil record the first appearance of the two species may be different, but we can confidently extend the range of the younger of our pair to coincide with that of the older species. This inferred extension is the ghost range: we don’t observe it, but we know it ought to be there.
The inclusion of ghost ranges thus inflates diversity and changes the numbers (the green line in the figure below). However, as we can see the two lines still track each other closely, although generally speaking the fluctuations are slightly less extreme with the ghost ranges than without.
It is important in addition to take account of variable sampling (see above). In seeking to distinguish the biological signal, that is, the true pattern of evolution, from the geological signal, which is all the biasing factors, it is necessary to manipulate the data. No method of correcting for sampling is perfect: indeed, whatever correction factor you use is likely to be just as subject to criticism, or error, as the figures you seek to correct.
One approach is to imagine all samples, that is, all collections of dinosaurs, were equalised to represent the poorest sampled time units. [It would be better to ‘improve’ the data so that all samples matched the best, but that would involve guesswork.] Effectively ‘degrading’ the data to match the most poorly sampled times is disappointing because good data are being abandoned, but at least all sampling bias should have been removed. One way to do this is by subsampling, where each sample (from a geological formation or a specified time interval) is randomly picked to amass the number of specimens known from the poorest sample – a process sometimes called rarefaction.
When we do this to our dinosaur database we can actually remove almost all of the fluctuations in dinosaur diversity – the change in dinosaur diversity becomes negligble (the red line). Interpreted literally, this implies that dinosaurs reached a global “carrying capacity” early on and diversity didn’t change much after this. Instead, dinosaurs successively replaced each other, perhaps through competition. However, we prefer a more cautious interpretation that simply states that sampling is a problem in dinosaur diversification.
Dinosaur diversification redetermined
How then, can we say anything about dinosaur diversity through time? One method that has so far been little used in palaeontology is to identify diversification shifts. In this approach, the phylogenetic tree is compared to a simple model of evolution which is assumed to be essentially random, with equal rates of splitting to right and left. Full information on these methods is given here.
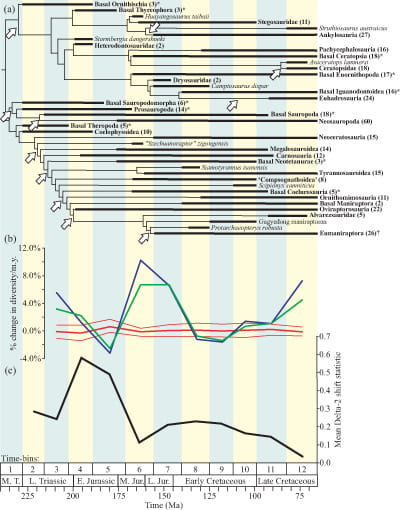
For dinosaurs there are eleven statistically significant diversification shifts, each corresponding to an unexpected proliferation of species. These are shown as white arrows in a) on the figure above. Interestingly, these events are concentrated early on in dinosaur history, particularly in the Early Jurassic (200 million years ago) coinciding with the end of the Triassic-Jurassic mass extinction phase. A further analysis indicates the likelihood of one of these major shifts occurring throughout dinosaurian history and this is shown in c) on the figure above. This too indicates that the Early Jurassic was an important time in the flourishing of dinosaurs and can be linked to the time when they became numerically the most dominant species of land-based vertebrates. For the rest of their history this likelihood slowly declined and through the Cretaceous dinosaurs were evolving much more steadily.
Dinosaurs and the Cretaceous Terrestrial Revolution
It might be argued that the dinosaur pattern is typical and that all clades show this early burst of diversification, but both empirical and theoretical studies indicate this is not the case. It seems probable then that the evolutionary quiescence of the Cretaceous may well have been biologically real. This matters for the simple reason that the Cretaceous heralded a new wave of terrestrial ecosystem complexity as the first flowering plants (angiosperms) appeared and radiated dramatically. Other groups, in particular the social insects such as bees and ants also exploded in diversity. Vertebrates too, such as lizards, snakes and early mammals adapted to exploit this new food source. Dinosaurs, it seems, were left behind. This idea is supported by other evidence (e.g. stomach contents and coprolites – fossil faeces) which tell us that although some dinosaurs ate angiosperms they were not selectively feeding on them. Dinosaurs, then, were not part of this Cretaceous Terrestrial Revolution.
Downloads
Full reference: Lloyd, G. T., Davis, K. E., Pisani, D., Tarver, J. E., Ruta, M., Sakamoto, M., Hone, D. W. E., Jennings, R., and Benton, M. J. 2008. Dinosaurs and the Cretaceous Terrestrial Revolution. Proceedings of the Royal Society, Series B 275, 2483-2490. pdf
Download the supertree as a single diagram, or in the three sections for theropods, sauropodomorphs, and ornithischians.
You can see a further version of the supertree, with zoom capabilities here.
Download a pdf of the phylogeny plotted against time.
Press coverage
- BBC News
- New Scientist by Colin Barras and Michael Marshall
- Nature
- Guardian by Tim Radford
- Daily Mail
- ABC News
- Science Daily